March 4, 2025 W Daily Analysis W Daily Analysis
W Daily Analysis
Outlook
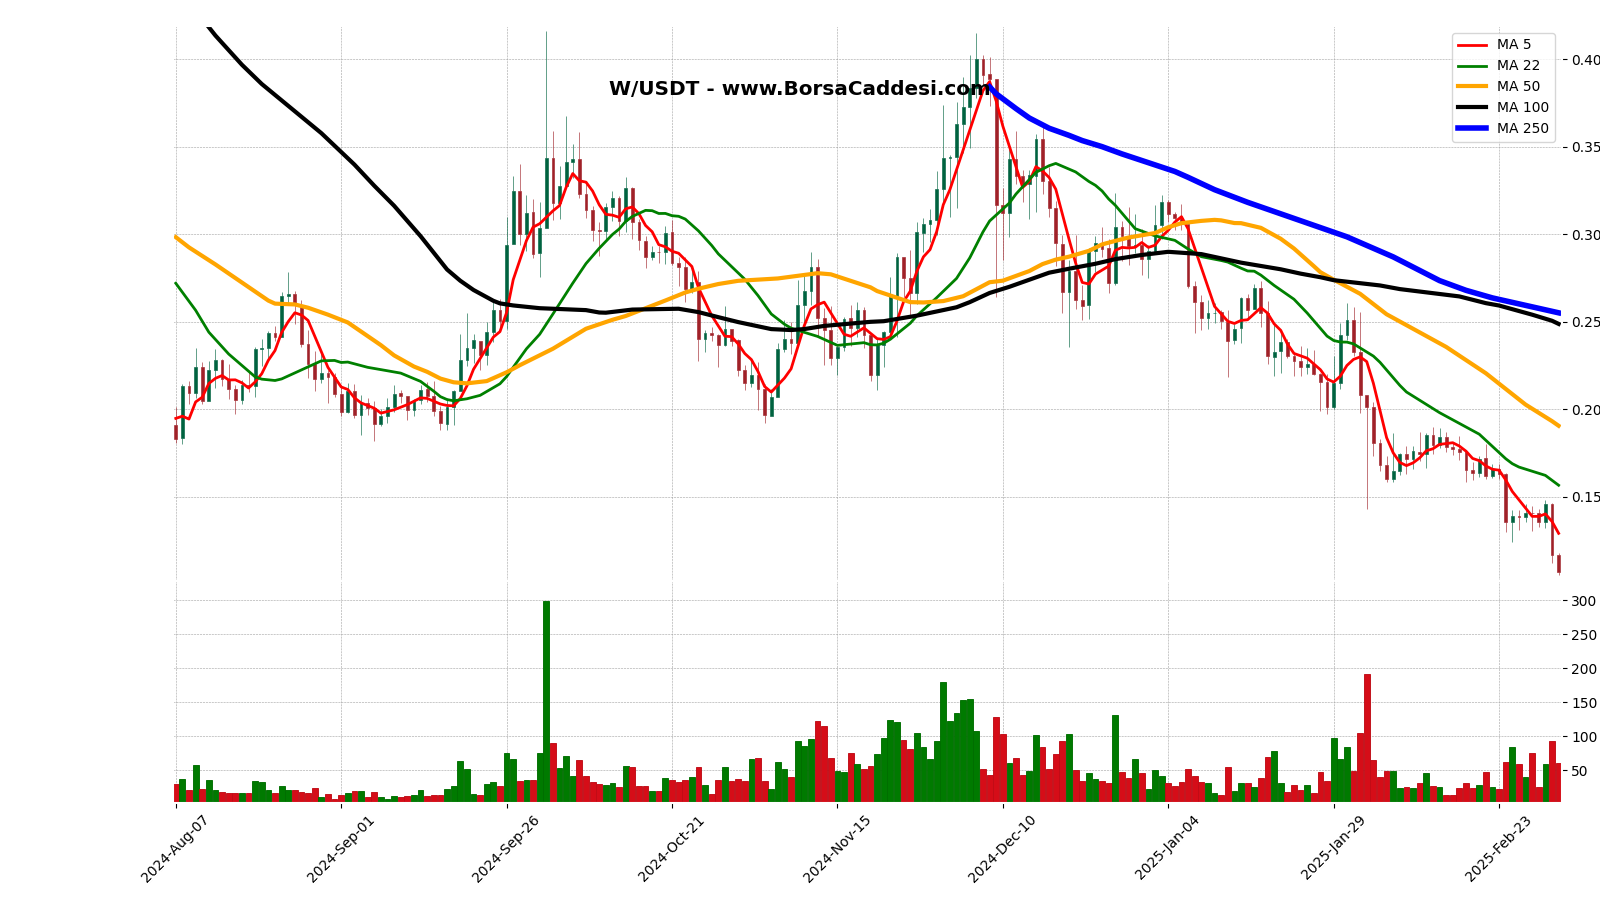
W current price is 0.107 USDT and the current market cap is 14.445.584 USDT. This chart period started 210 days ago (07 August 2024) with a total of 97 days closing above the opening price and 112 days closing below the opening price. The lowest price was 0.1051 USDT on 04 March 2025, and the highest price was 0.416 USDT on 02 October 2024. The current price is 1.81% above the lowest price and 74.28% below the highest price.
Moving Average
Moving Averages (Closing Prices):5-Day Moving Average: 0.1291422-Day Moving Average: 0.156618181850-Day Moving Average: 0.190604100-Day Moving Average: 0.248816250-Day Moving Average: 0.2551652
Moving Average Analysis
The current price is %17.14 lower than the 5-Day moving average and has been below it for 2 days.The current price is %31.68 lower than the 22-Day moving average and has been below it for 9 days.The current price is %43.86 lower than the 50-Day moving average and has been below it for 29 days.The current price is %57.00 lower than the 100-Day moving average and has been below it for 32 days.The current price is %58.07 lower than the 250-Day moving average and has been below it for 46 days.
Trends
The longest uptrend in the 210 day period is 10 days. It started at 0.2665 USDT on 26 November 2024 and ended by increasing by 50.17% to 0.4002 USDT on 06 December 2024.The longest downtrend is 6 days. It started at 0.3182 USDT on 03 January 2025 and ended by decreasing -20.71% to 0.2523 USDT on 09 January 2025.
Support & Resistance
This review was made for the last 7 daysLast 7 days support levels: Support: 0.1304 USDT on 28-02-2025 Support: 0.1324 USDT on 02-03-2025 Support: 0.1124 USDT on 03-03-2025 Support: 0.1051 USDT on 04-03-2025Last 7 days resistance levels: Resistance: 0.1459 USDT on 27-02-2025 Resistance: 0.1479 USDT on 02-03-2025The lowest support level is 0.1051 USDT on 04-03-2025, and the highest resistance level is 0.1479 USDT on 02-03-2025. The percentage difference between these levels is approximately 40.7%.
Volume
Fetched 336 data points, less than 500 days of data. Adjusting limit.The previous trading day’s volume (03-03-2025) 93,697,645.20 USDT. Highest volume in the last 210 days is 298,626,824.30 USDT on 02-10-2024. Lowest volume in the last 210 days is 7,196,983.60 USDT on 31-08-2024. Difference between highest and lowest volume is 4049.33%.
Volume Moving Averages
( Excluding Today)
5-day Moving Average Volume: 58,521,026.46 USDT22-day Moving Average Volume: 40,143,775.16 USDT50-day Moving Average Volume: 46,065,157.64 USDT100-day Moving Average Volume: 58,110,564.45 USDT250-day Moving Average Volume: 46,292,270.10 USDT
Volume Moving Averages Comparison
Volume of the previous trading day: 93,697,645.20 USDT
Previous day’s volume is 60.11% higher than the 5-day moving average.Previous day’s volume is 133.41% higher than the 22-day moving average.Previous day’s volume is 103.40% higher than the 50-day moving average.Previous day’s volume is 61.24% higher than the 100-day moving average.Previous day’s volume is 102.40% higher than the 250-day moving average.
Percentage Differences Between Moving Averages:
5-day moving average is 45.78% higher than the 22-day moving average.22-day moving average is -12.85% lower than the 50-day moving average.50-day moving average is -20.73% lower than the 100-day moving average.100-day moving average is 25.53% higher than the 250-day moving average.
Volume Trend
The longest consecutive volume increase started on 14-09-2024 with a volume of 12,744,109.00 USDT and ended on 19-09-2024 with a volume of 63,631,989.80 USDT, lasting for 5 days and representing a 399.31% increase.The longest consecutive volume decrease started on 07-01-2025 with a volume of 51,754,918.50 USDT and ended on 12-01-2025 with a volume of 14,331,520.80 USDT, lasting for 5 days and representing a 72.31% decrease.
Price Volume Coorelation
During the longest volume increasing period price increase from 0.2074 USDT to 0.2284 USDT, which represents a 10.13% change.During the longest volume decreasing period price decrease from 0.2704 USDT to 0.2502 USDT, which represents a -7.47% change.
Strategy
There is no trend formation at the moment. We should wait until a trend forms.
Legal Disclaimer: This Chart and The Accompanying Analyses Are Not Investment Advice.


