March 27, 2025 BTC – Bitcoin Daily Analysis BTC – Bitcoin Daily Analysis
BTC – Bitcoin Daily Analysis
Outlook
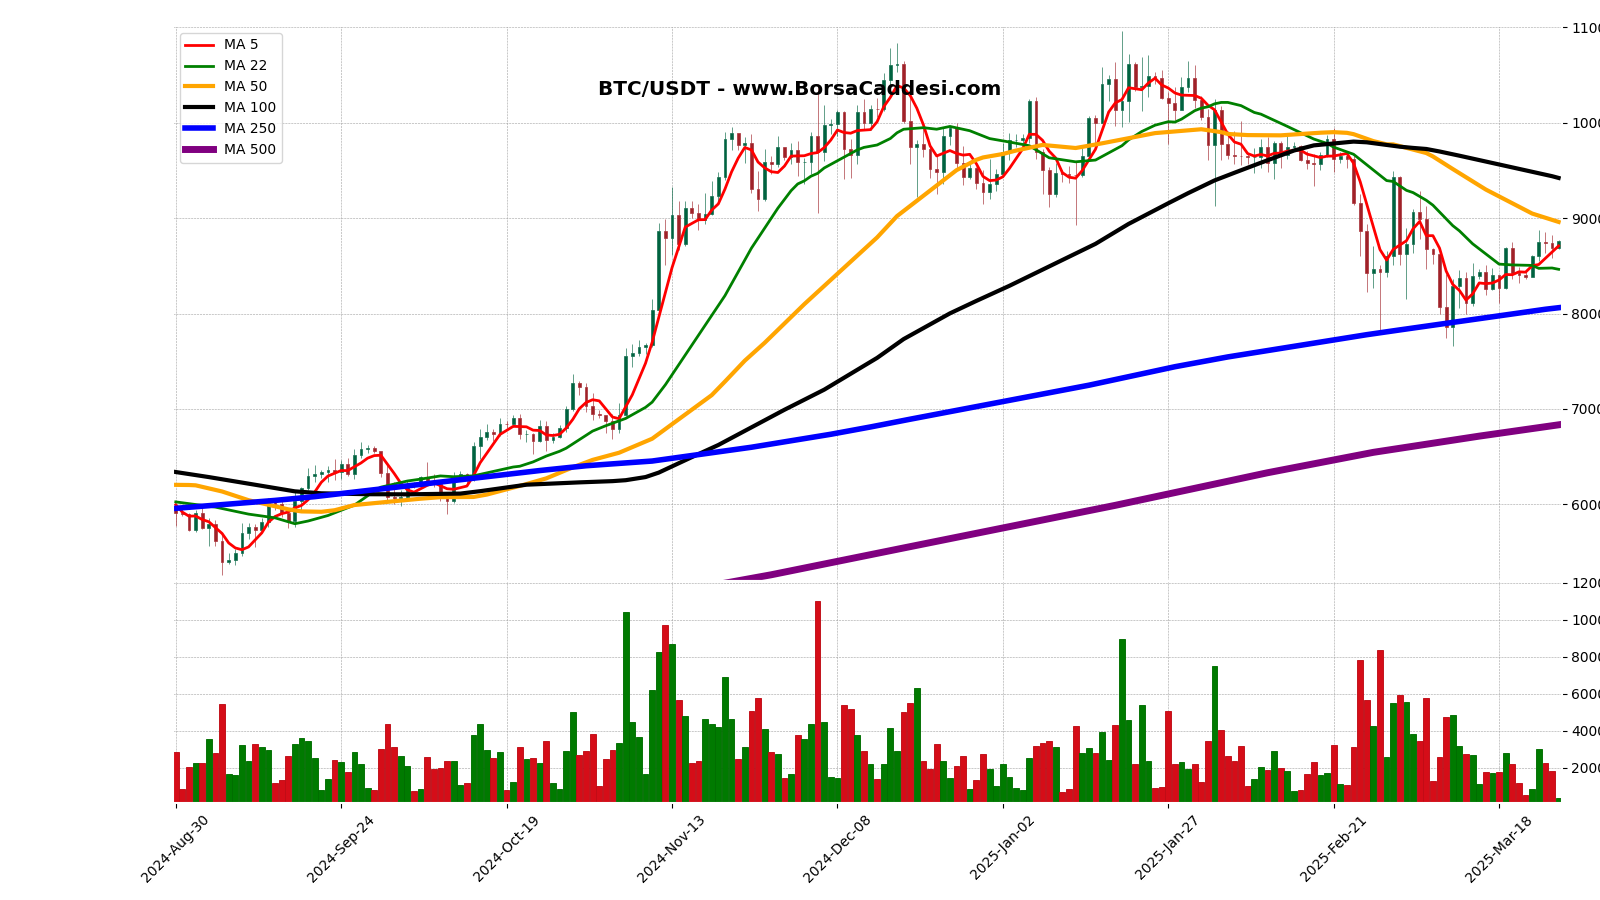
BTC current price is 87593.31 USDT and the current market cap is 1.473.724.027 USDT. This chart period started 210 days ago (30 August 2024) with a total of 107 days closing above the opening price and 103 days closing below the opening price. The lowest price was 52550.00 USDT on 06 September 2024, and the highest price was 109588.00 USDT on 20 January 2025. The current price is 66.69% above the lowest price and 20.07% below the highest price.
Moving Average
Moving Averages (Closing Prices):5-Day Moving Average: 87095.2022-Day Moving Average: 84641.4250-Day Moving Average: 89606.65100-Day Moving Average: 94219.12250-Day Moving Average: 80614.44500-Day Moving Average: 68337.12
Moving Average Analysis
The current price is %0.57 higher than the 5-Day moving average and has been above it for 1 days.The current price is %3.49 higher than the 22-Day moving average and has been above it for 5 days.The current price is %2.25 lower than the 50-Day moving average and has been below it for 21 days.The current price is %7.03 lower than the 100-Day moving average and has been below it for 25 days.The current price is %8.66 higher than the 250-Day moving average and has been above it for 17 days.The current price is %28.18 higher than the 500-Day moving average and has been above it for 143 days.
Trends
The longest uptrend in the 210 day period is 7 days. It started at 67850.01 USDT on 04 November 2024 and ended by increasing by 30.65% to 88647.99 USDT on 11 November 2024.The longest downtrend is 6 days. It started at 72736.42 USDT on 29 October 2024 and ended by decreasing -6.72% to 67850.01 USDT on 04 November 2024.
Support & Resistance
This review was made for the last 7 daysLast 7 days support levels: Support: 85860.00 USDT on 26-03-2025Last 7 days resistance levels: Resistance: 86129.64 USDT on 23-03-2025 Resistance: 88765.43 USDT on 24-03-2025The lowest support level is 85860.00 USDT on 26-03-2025, and the highest resistance level is 88765.43 USDT on 24-03-2025. The percentage difference between these levels is approximately 3.4%.
Volume
The previous trading day’s volume (26-03-2025) 18,408.78 USDT. Highest volume in the last 210 days is 109,921.73 USDT on 05-12-2024. Lowest volume in the last 210 days is 4,033.82 USDT on 27-03-2025. Difference between highest and lowest volume is 2625.00%.
Volume Moving Averages
( Excluding Today)
5-day Moving Average Volume: 17,009.97 USDT22-day Moving Average Volume: 25,610.38 USDT50-day Moving Average Volume: 28,147.79 USDT100-day Moving Average Volume: 28,623.56 USDT250-day Moving Average Volume: 30,376.07 USDT
Volume Moving Averages Comparison
Volume of the previous trading day: 18,408.78 USDT
Previous day’s volume is 8.22% higher than the 5-day moving average.Previous day’s volume is 28.12% lower than the 22-day moving average.Previous day’s volume is 34.60% lower than the 50-day moving average.Previous day’s volume is 35.69% lower than the 100-day moving average.Previous day’s volume is 39.40% lower than the 250-day moving average.
Percentage Differences Between Moving Averages:
5-day moving average is -33.58% lower than the 22-day moving average.22-day moving average is -9.01% lower than the 50-day moving average.50-day moving average is -1.66% lower than the 100-day moving average.100-day moving average is -5.77% lower than the 250-day moving average.
Volume Trend
The longest consecutive volume increase started on 14-09-2024 with a volume of 12,137.91 USDT and ended on 18-09-2024 with a volume of 36,087.02 USDT, lasting for 4 days and representing a 197.31% increase.The longest consecutive volume decrease started on 09-12-2024 with a volume of 53,949.12 USDT and ended on 14-12-2024 with a volume of 14,191.70 USDT, lasting for 5 days and representing a 73.69% decrease.
Price Volume Coorelation
During the longest volume increasing period price increase from 59993.03 USDT to 61759.99 USDT, which represents a 2.95% change.During the longest volume decreasing period price increase from 97276.47 USDT to 101420.00 USDT, which represents a 4.26% change.
Strategy
It has closed with a decline for the last two days. However, if the uptrend continues tomorrow, the previous day’s open can be the stop-loss, and a ‘long’ position can be taken.
Legal Disclaimer: This Chart and The Accompanying Analyses Are Not Investment Advice.


