March 7, 2025 BRETT Daily Analysis BRETT Daily Analysis
BRETT Daily Analysis
Outlook
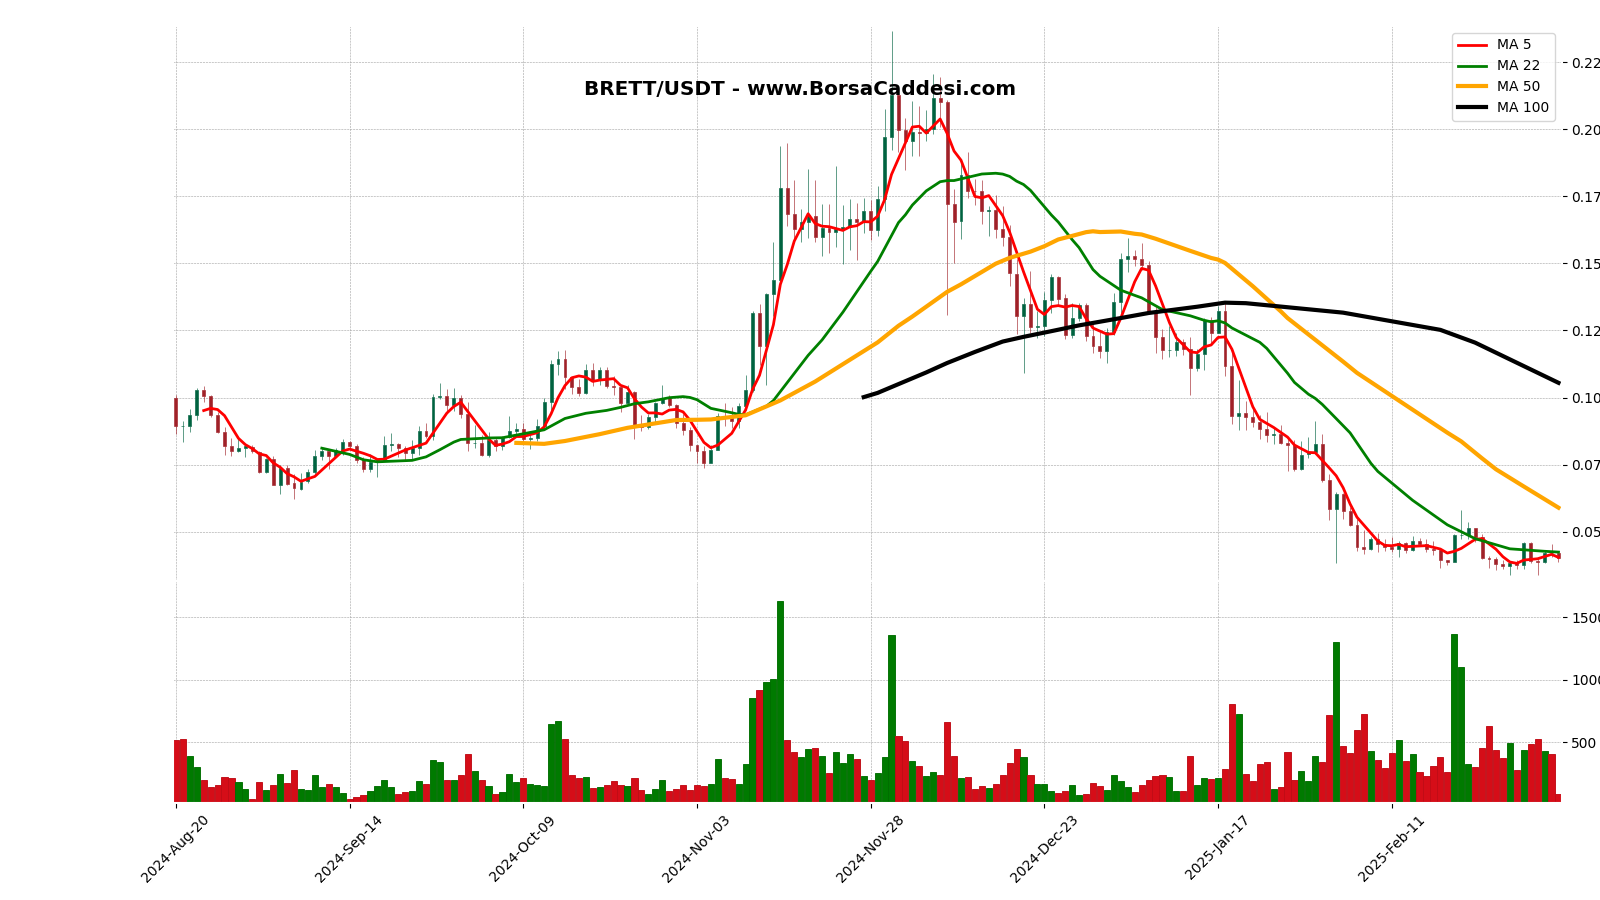
BRETT current price is 0.04021 USDT and the current market cap is 19.995.437 USDT. This chart period started 210 days ago (20 August 2024) with a total of 91 days closing above the opening price and 108 days closing below the opening price. The lowest price was 0.03365 USDT on 28 February 2025, and the highest price was 0.23657 USDT on 01 December 2024. The current price is 19.49% above the lowest price and 83.00% below the highest price.
Moving Average
Moving Averages (Closing Prices):5-Day Moving Average: 0.04037222-Day Moving Average: 0.0423450-Day Moving Average: 0.0589054100-Day Moving Average: 0.105481
Moving Average Analysis
The current price is %0.40 lower than the 5-Day moving average and has been below it for 1 days.The current price is %5.03 lower than the 22-Day moving average and has been below it for 5 days.The current price is %31.74 lower than the 50-Day moving average and has been below it for 32 days.The current price is %61.88 lower than the 100-Day moving average and has been below it for 48 days.
Trends
The longest uptrend in the 210 day period is 5 days. It started at 0.08444 USDT on 09 October 2024 and ended by increasing by 35.62% to 0.11452 USDT on 14 October 2024.The longest downtrend is 6 days. It started at 0.09986 USDT on 29 October 2024 and ended by decreasing -24.20% to 0.07569 USDT on 04 November 2024.
Support & Resistance
This review was made for the last 7 daysLast 7 days support levels: Support: 0.03395 USDT on 04-03-2025 Support: 0.03863 USDT on 07-03-2025Last 7 days resistance levels: Resistance: 0.04617 USDT on 02-03-2025 Resistance: 0.04322 USDT on 05-03-2025 Resistance: 0.04535 USDT on 06-03-2025The lowest support level is 0.03395 USDT on 04-03-2025, and the highest resistance level is 0.04617 USDT on 02-03-2025. The percentage difference between these levels is approximately 36.0%.
Volume
Fetched 200 data points, less than 500 days of data. Adjusting limit.The previous trading day’s volume (06-03-2025) 407,538,895.00 USDT. Highest volume in the last 210 days is 1,629,945,519.00 USDT on 15-11-2024. Lowest volume in the last 210 days is 41,262,696.00 USDT on 14-09-2024. Difference between highest and lowest volume is 3850.17%.
Volume Moving Averages
( Excluding Today)
5-day Moving Average Volume: 457,284,449.20 USDT22-day Moving Average Volume: 464,149,971.82 USDT50-day Moving Average Volume: 436,781,932.04 USDT100-day Moving Average Volume: 343,785,533.62 USDT
Volume Moving Averages Comparison
Volume of the previous trading day: 407,538,895.00 USDT
Previous day’s volume is 10.88% lower than the 5-day moving average.Previous day’s volume is 12.20% lower than the 22-day moving average.Previous day’s volume is 6.70% lower than the 50-day moving average.Previous day’s volume is 18.54% higher than the 100-day moving average.
Percentage Differences Between Moving Averages:
5-day moving average is -1.48% lower than the 22-day moving average.22-day moving average is 6.27% higher than the 50-day moving average.50-day moving average is 27.05% higher than the 100-day moving average.
Volume Trend
The longest consecutive volume increase started on 09-11-2024 with a volume of 163,550,330.00 USDT and ended on 15-11-2024 with a volume of 1,629,945,519.00 USDT, lasting for 6 days and representing a 896.60% increase.The longest consecutive volume decrease started on 19-12-2024 with a volume of 443,470,248.00 USDT and ended on 25-12-2024 with a volume of 89,487,759.00 USDT, lasting for 6 days and representing a 79.82% decrease.
Price Volume Coorelation
During the longest volume increasing period price increase from 0.09692 USDT to 0.17804 USDT, which represents a 83.70% change.During the longest volume decreasing period price increase from 0.13041 USDT to 0.1369 USDT, which represents a 4.98% change.
Strategy
There is no trend formation at the moment. We should wait until a trend forms.
Legal Disclaimer: This Chart and The Accompanying Analyses Are Not Investment Advice.


