March 10, 2025 APE- Apecoin Daily Analysis APE- Apecoin Daily Analysis
APE- Apecoin Daily Analysis
Outlook
APE current price is 0.4668 USDT and the current market cap is 6.577.608 USDT. This chart period started 210 days ago (12 August 2024) with a total of 108 days closing above the opening price and 102 days closing below the opening price. The lowest price was 0.4615 USDT on 09 March 2025, and the highest price was 2.17 USDT on 04 December 2024. The current price is 1.15% above the lowest price and 78.47% below the highest price.
Moving Average
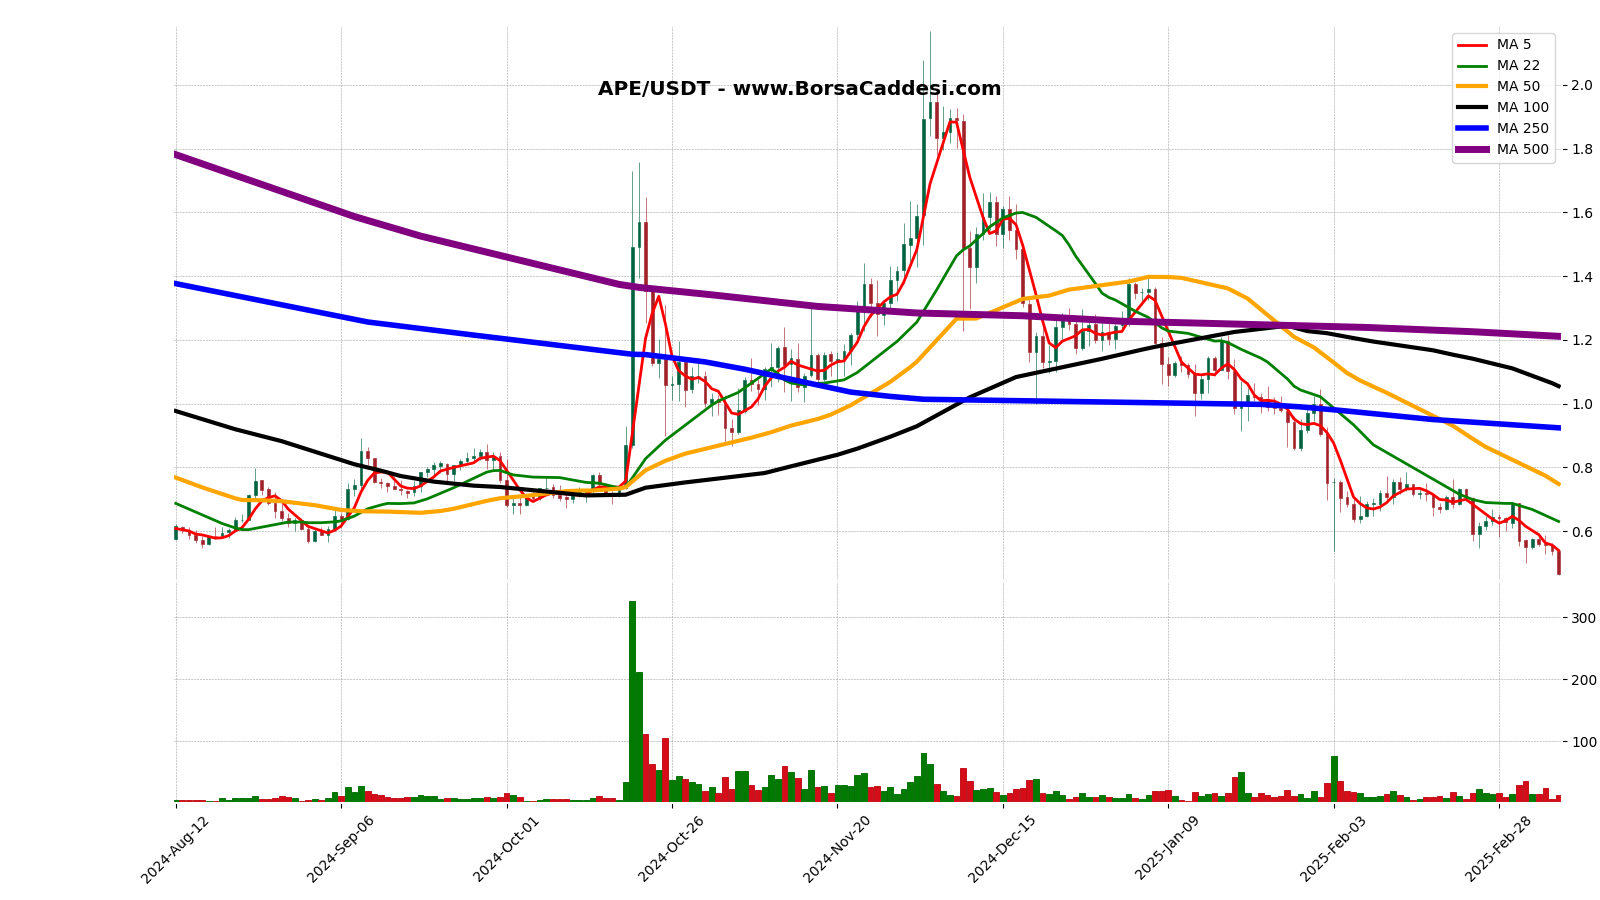
Moving Averages (Closing Prices):5-Day Moving Average: 0.5399422-Day Moving Average: 0.630668181850-Day Moving Average: 0.748354100-Day Moving Average: 1.06250-Day Moving Average: 0.9244068500-Day Moving Average: 1.21
Moving Average Analysis
The current price is %13.55 lower than the 5-Day moving average and has been below it for 2 days.The current price is %25.98 lower than the 22-Day moving average and has been below it for 7 days.The current price is %37.62 lower than the 50-Day moving average and has been below it for 23 days.The current price is %55.76 lower than the 100-Day moving average and has been below it for 50 days.The current price is %49.50 lower than the 250-Day moving average and has been below it for 37 days.The current price is %61.47 lower than the 500-Day moving average and has been below it for 62 days.
Trends
The longest uptrend in the 210 day period is 8 days. It started at 1.28 USDT on 26 November 2024 and ended by increasing by 51.95% to 1.95 USDT on 04 December 2024.The longest downtrend is 7 days. It started at 0.851 USDT on 09 September 2024 and ended by decreasing -15.28% to 0.721 USDT on 16 September 2024.
Support & Resistance
This review was made for the last 7 daysLast 7 days support levels: Support: 0.499 USDT on 04-03-2025 Support: 0.5293 USDT on 07-03-2025 Support: 0.5241 USDT on 08-03-2025 Support: 0.4615 USDT on 09-03-2025Last 7 days resistance levels: Resistance: 0.58 USDT on 05-03-2025 Resistance: 0.5927 USDT on 06-03-2025The lowest support level is 0.4615 USDT on 09-03-2025, and the highest resistance level is 0.5927 USDT on 06-03-2025. The percentage difference between these levels is approximately 28.4%.
Volume
The previous trading day’s volume (08-03-2025) 7,112,855.90 USDT. Highest volume in the last 210 days is 325,902,197.21 USDT on 20-10-2024. Lowest volume in the last 210 days is 3,210,398.26 USDT on 31-08-2024. Difference between highest and lowest volume is 10051.46%.
Volume Moving Averages
( Excluding Today)
5-day Moving Average Volume: 19,618,017.22 USDT22-day Moving Average Volume: 14,987,573.18 USDT50-day Moving Average Volume: 18,015,483.96 USDT100-day Moving Average Volume: 19,465,247.45 USDT250-day Moving Average Volume: 19,862,450.62 USDT
Volume Moving Averages Comparison
Volume of the previous trading day: 7,112,855.90 USDT
Previous day’s volume is 63.74% lower than the 5-day moving average.Previous day’s volume is 52.54% lower than the 22-day moving average.Previous day’s volume is 60.52% lower than the 50-day moving average.Previous day’s volume is 63.46% lower than the 100-day moving average.Previous day’s volume is 64.19% lower than the 250-day moving average.
Percentage Differences Between Moving Averages:
5-day moving average is 30.90% higher than the 22-day moving average.22-day moving average is -16.81% lower than the 50-day moving average.50-day moving average is -7.45% lower than the 100-day moving average.100-day moving average is -2.00% lower than the 250-day moving average.
Volume Trend
The longest consecutive volume increase started on 15-12-2024 with a volume of 12,787,994.65 USDT and ended on 20-12-2024 with a volume of 39,433,714.56 USDT, lasting for 5 days and representing a 208.37% increase.The longest consecutive volume decrease started on 09-09-2024 with a volume of 27,806,802.99 USDT and ended on 14-09-2024 with a volume of 8,484,556.57 USDT, lasting for 5 days and representing a 69.49% decrease.
Price Volume Coorelation
During the longest volume increasing period price decrease from 1.61 USDT to 1.21 USDT, which represents a -24.78% change.During the longest volume decreasing period price decrease from 0.851 USDT to 0.734 USDT, which represents a -13.75% change.
Strategy
Under sales pressure, we should observe where the decline will end and then reassess. Currently, we do not recommend opening a ‘long’ position.
Legal Disclaimer: This Chart and The Accompanying Analyses Are Not Investment Advice.


