
December 17, 2024 AMP Daily Chart Analysis
Outlook
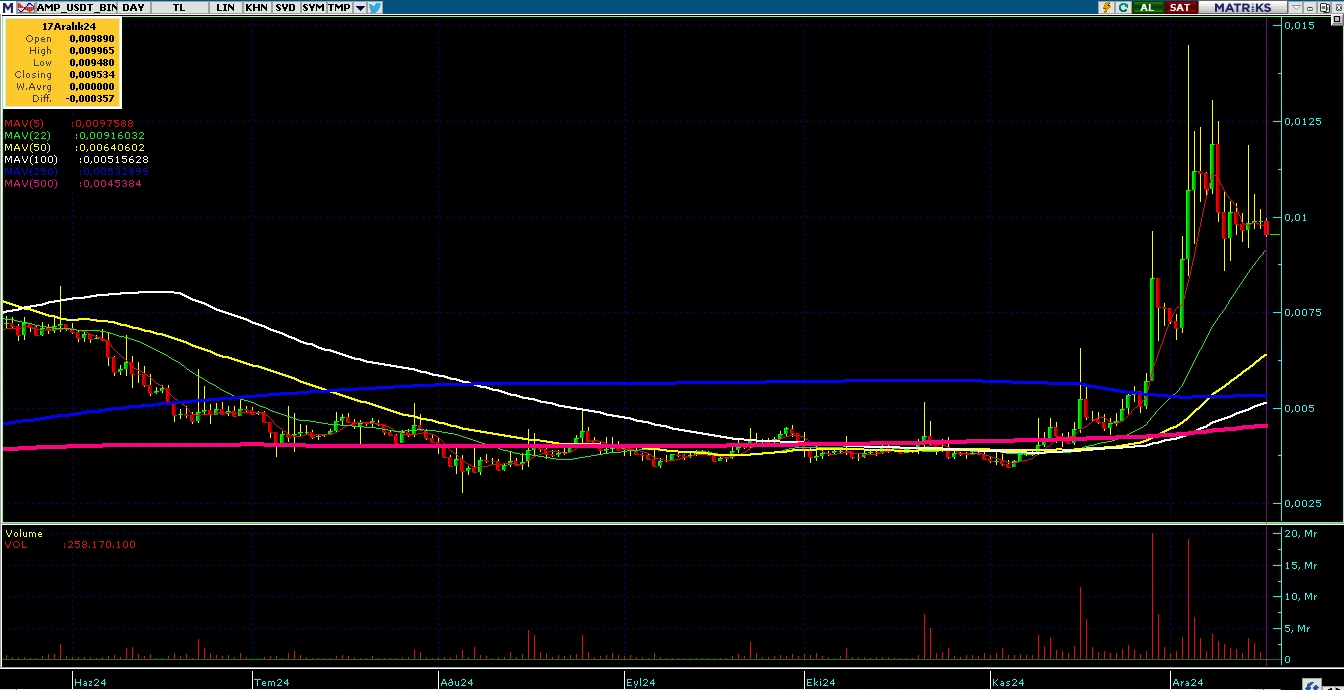
AMP current price is 0.01 USDT and the current market cap is 9.354.047 USDT. This chart period started 210 days ago (22 May 2024) with a total of 99 days closing above the opening price and 110 days closing below the opening price. The lowest price was 0.00 USDT on 05 August 2024, and the highest price was 0.01 USDT on 04 December 2024. The current price is 243.65% above the lowest price and 34.73% below the highest price.
Moving Average
Moving Averages (Closing Prices):
5-Day Moving Average: 0.01
22-Day Moving Average: 0.01
50-Day Moving Average: 0.01
100-Day Moving Average: 0.01
250-Day Moving Average: 0.01
Moving Average Analysis
The current price is %-3.17 higher than the 5-Day moving average and has been above it for 0 days.
The current price is %4.08 higher than the 22-Day moving average and has been above it for 14 days.
The current price is %48.31 higher than the 50-Day moving average and has been above it for 20 days.
The current price is %83.94 higher than the 100-Day moving average and has been above it for 21 days.
The current price is %77.83 higher than the 250-Day moving average and has been above it for 21 days.
The current price is %108.70 higher than the 500-Day moving average and has been above it for 27 days.
Trends
The longest uptrend in the 210 day period is 5 days. It started at 0.00 USDT on 11 July 2024 and ended by increasing by 12.51% to 0.00 USDT on 16 July 2024.
The longest downtrend is 8 days. It started at 0.00 USDT on 28 July 2024 and ended by decreasing -29.19% to 0.00 USDT on 05 August 2024.
Support & Resistance
This review was made for the last 7 days
Last 7 days support levels:
Support: 0.01 USDT on 13-12-2024
Support: 0.01 USDT on 14-12-2024
Support: 0.01 USDT on 16-12-2024
Support: 0.01 USDT on 17-12-2024
Last 7 days resistance levels:
Resistance: 0.01 USDT on 14-12-2024
The lowest support level is 0.01 USDT on 14-12-2024, and the highest resistance level is 0.01 USDT on 14-12-2024. The percentage difference between these levels is approximately 29.4%.
Volume
The previous trading day’s volume (16-12-2024) 989,830,602.00 USDT. Highest volume in the last 210 days is 19,678,753,499.00 USDT on 28-11-2024. Lowest volume in the last 210 days is 138,798,756.00 USDT on 13-07-2024. Difference between highest and lowest volume is 14077.90%.
Volume Moving Averages
( Excluding Today)
5-day Moving Average Volume: 1,953,924,989.00 USDT
22-day Moving Average Volume: 4,104,014,572.73 USDT
50-day Moving Average Volume: 2,874,045,978.12 USDT
100-day Moving Average Volume: 1,832,567,199.94 USDT
250-day Moving Average Volume: 1,195,900,986.68 USDT
Volume Moving Averages Comparison
Volume of the previous trading day: 989,830,602.00 USDT
Previous day’s volume is 49.34% lower than the 5-day moving average.
Previous day’s volume is 75.88% lower than the 22-day moving average.
Previous day’s volume is 65.56% lower than the 50-day moving average.
Previous day’s volume is 45.99% lower than the 100-day moving average.
Previous day’s volume is 17.23% lower than the 250-day moving average.
Percentage Differences Between Moving Averages:
5-day moving average is -52.39% lower than the 22-day moving average.
22-day moving average is 42.80% higher than the 50-day moving average.
50-day moving average is 56.83% higher than the 100-day moving average.
100-day moving average is 53.24% higher than the 250-day moving average.
Volume Trend
The longest consecutive volume increase started on 26-05-2024 with a volume of 221,230,049.00 USDT and ended on 30-05-2024 with a volume of 2,379,757,805.00 USDT, lasting for 4 days and representing a 975.69% increase.
The longest consecutive volume decrease started on 08-07-2024 with a volume of 1,397,241,551.00 USDT and ended on 13-07-2024 with a volume of 138,798,756.00 USDT, lasting for 5 days and representing a 90.07% decrease.
Price Volume Coorelation
During the longest volume increasing period price increased from 0.01 USDT to 0.01 USDT, which represents a 4.01% increase.
During the longest volume decreasing period price decreased from 0.00 USDT to 0.00 USDT, which represents a -0.07% decrease.
Strategy
AMP, which recently reached a peak and entered a correction, is under serious selling pressure. If two consecutive days of increasing closing occur, the previous day’s opening level can be determined as a stop loss and a “long” position can be opened.
AMP
Legal Disclaimer: This Chart and The Accompanying Analyses Are Not Investment Advice.


