March 11, 2025 AMP Daily Analysis AMP Daily Analysis
AMP Daily Analysis
Outlook
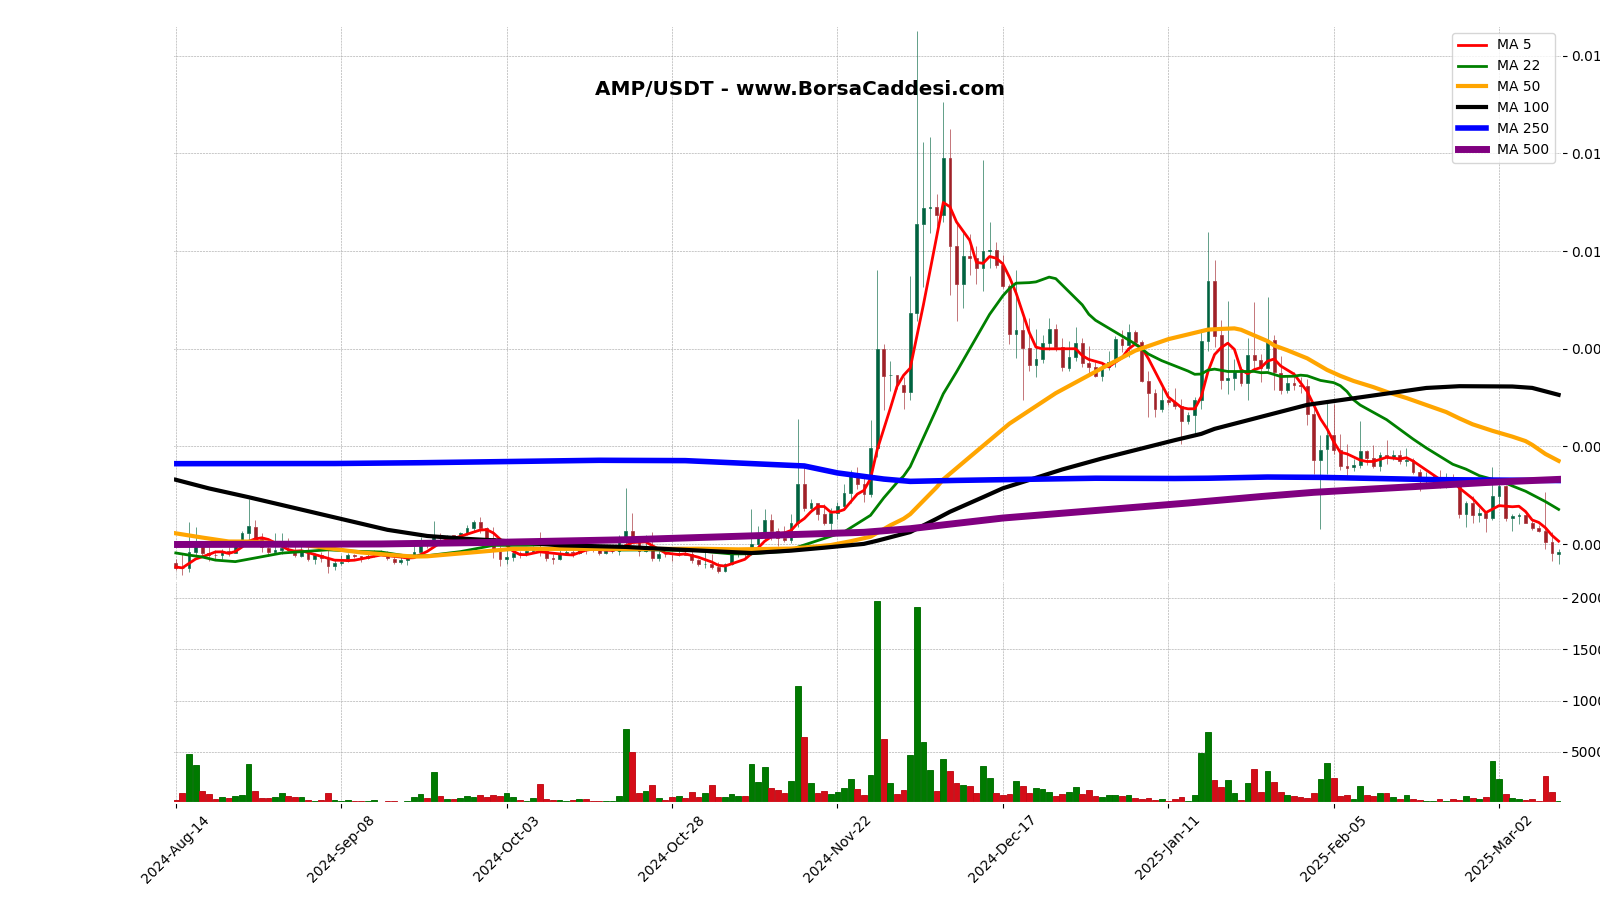
AMP current price is 0.003847 USDT and the current market cap is 3.730.652 USDT. This chart period started 210 days ago (14 August 2024) with a total of 100 days closing above the opening price and 110 days closing below the opening price. The lowest price was 0.00336 USDT on 15 August 2024, and the highest price was 0.0145 USDT on 04 December 2024. The current price is 14.49% above the lowest price and 73.47% below the highest price.
Moving Average
Moving Averages (Closing Prices):5-Day Moving Average: 0.00406122-Day Moving Average: 0.004710954550-Day Moving Average: 0.00570486100-Day Moving Average: 0.00705743250-Day Moving Average: 0.005302168500-Day Moving Average: 0.005325722
Moving Average Analysis
The current price is %5.27 lower than the 5-Day moving average and has been below it for 3 days.The current price is %18.34 lower than the 22-Day moving average and has been below it for 9 days.The current price is %32.57 lower than the 50-Day moving average and has been below it for 23 days.The current price is %45.49 lower than the 100-Day moving average and has been below it for 39 days.The current price is %27.44 lower than the 250-Day moving average and has been below it for 17 days.The current price is %27.77 lower than the 500-Day moving average and has been below it for 17 days.
Trends
The longest uptrend in the 210 day period is 4 days. It started at 0.003638 USDT on 16 September 2024 and ended by increasing by 9.92% to 0.003999 USDT on 20 September 2024.The longest downtrend is 5 days. It started at 0.004597 USDT on 05 March 2025 and ended by decreasing -17.10% to 0.003811 USDT on 10 March 2025.
Support & Resistance
This review was made for the last 7 daysLast 7 days support levels: Support: 0.004295 USDT on 07-03-2025 Support: 0.004245 USDT on 08-03-2025 Support: 0.0039 USDT on 09-03-2025 Support: 0.003658 USDT on 10-03-2025 Support: 0.00359 USDT on 11-03-2025Last 7 days resistance levels: Resistance: 0.004661 USDT on 06-03-2025 Resistance: 0.005059 USDT on 09-03-2025The lowest support level is 0.00359 USDT on 11-03-2025, and the highest resistance level is 0.005059 USDT on 09-03-2025. The percentage difference between these levels is approximately 40.9%.
Volume
The previous trading day’s volume (10-03-2025) 1,121,486,324.00 USDT. Highest volume in the last 210 days is 19,678,753,499.00 USDT on 28-11-2024. Lowest volume in the last 210 days is 164,482,528.00 USDT on 17-09-2024. Difference between highest and lowest volume is 11864.04%.
Volume Moving Averages
( Excluding Today)
5-day Moving Average Volume: 954,505,401.40 USDT22-day Moving Average Volume: 824,374,386.09 USDT50-day Moving Average Volume: 1,118,099,731.66 USDT100-day Moving Average Volume: 1,547,540,992.92 USDT250-day Moving Average Volume: 1,319,935,072.84 USDT
Volume Moving Averages Comparison
Volume of the previous trading day: 1,121,486,324.00 USDT
Previous day’s volume is 17.49% higher than the 5-day moving average.Previous day’s volume is 36.04% higher than the 22-day moving average.Previous day’s volume is 0.30% higher than the 50-day moving average.Previous day’s volume is 27.53% lower than the 100-day moving average.Previous day’s volume is 15.03% lower than the 250-day moving average.
Percentage Differences Between Moving Averages:
5-day moving average is 15.79% higher than the 22-day moving average.22-day moving average is -26.27% lower than the 50-day moving average.50-day moving average is -27.75% lower than the 100-day moving average.100-day moving average is 17.24% higher than the 250-day moving average.
Volume Trend
The longest consecutive volume increase started on 22-08-2024 with a volume of 477,891,439.00 USDT and ended on 25-08-2024 with a volume of 3,853,368,613.00 USDT, lasting for 3 days and representing a 706.33% increase.The longest consecutive volume decrease started on 26-01-2025 with a volume of 3,117,784,231.00 USDT and ended on 01-02-2025 with a volume of 559,398,417.00 USDT, lasting for 6 days and representing a 82.06% decrease.
Price Volume Coorelation
During the longest volume increasing period price increase from 0.003824 USDT to 0.004363 USDT, which represents a 14.10% change.During the longest volume decreasing period price decrease from 0.00818 USDT to 0.006667 USDT, which represents a -18.50% change.
Strategy
It has closed with a decline for the last two days. However, if the uptrend continues tomorrow, the previous day’s open can be the stop-loss, and a ‘long’ position can be taken.
Legal Disclaimer: This Chart and The Accompanying Analyses Are Not Investment Advice.


