December 23, 2024 AEVO Daily Chart Analysis
Outlook
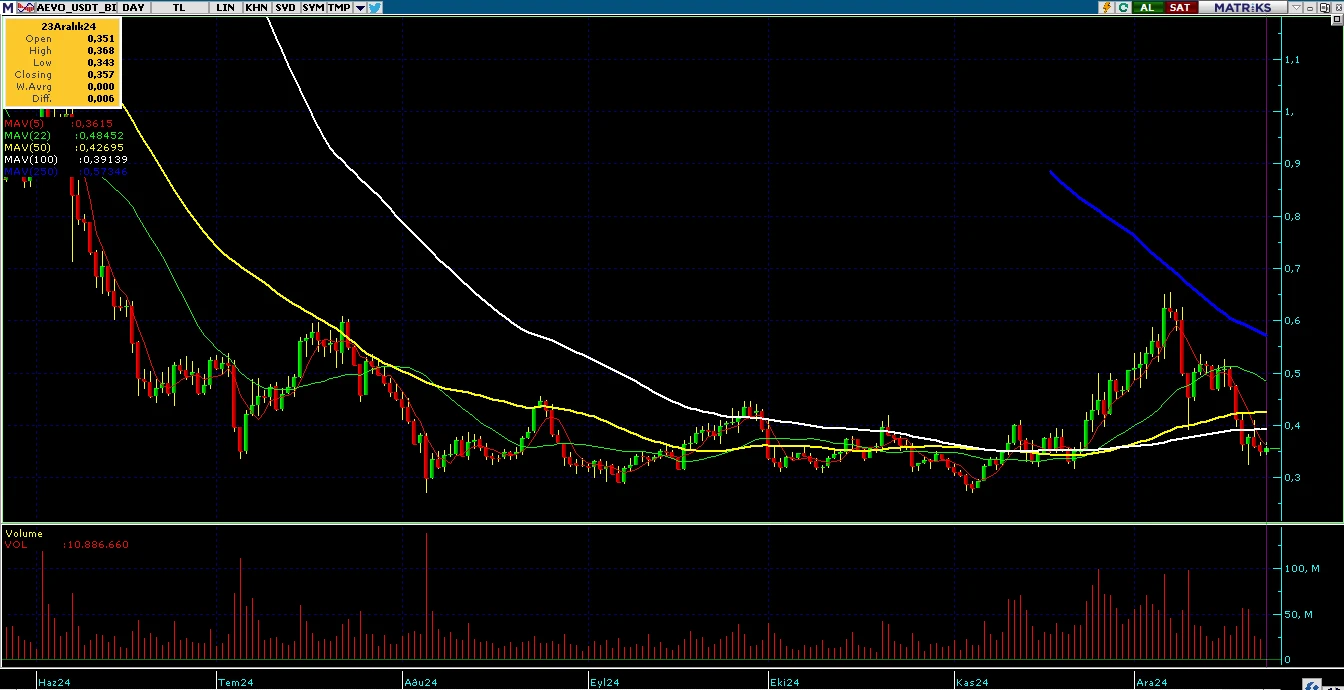
AEVO current price is 0.3595 USDT and the current market cap is 8.535.152 USDT. This chart period started 210 days ago (28 May 2024) with a total of 97 days closing above the opening price and 112 days closing below the opening price. The lowest price was 0.269 USDT on 05 August 2024, and the highest price was 1.13 USDT on 02 June 2024. The current price is 33.64% above the lowest price and 68.10% below the highest price.
Moving Average
Moving Averages (Closing Prices):
5-Day Moving Average: 0.36
22-Day Moving Average: 0.49
50-Day Moving Average: 0.43
100-Day Moving Average: 0.39
250-Day Moving Average: 0.57
Moving Average Analysis
The current price is %1.04 lower than the 5-Day moving average and has been below it for 0 days.
The current price is %25.97 lower than the 22-Day moving average and has been below it for 0 days.
The current price is %16.29 lower than the 50-Day moving average and has been below it for 0 days.
The current price is %8.52 lower than the 100-Day moving average and has been below it for 0 days.
The current price is %37.36 lower than the 250-Day moving average and has been below it for 0 days.
Trends
The longest uptrend in the 210 day period is 8 days. It started at 0.33 USDT on 16 August 2024 and ended by increasing by 33.33% to 0.44 USDT on 24 August 2024.
The longest downtrend is 10 days. It started at 0.52 USDT on 26 July 2024 and ended by decreasing -42.80% to 0.30 USDT on 05 August 2024.
Support & Resistance
This review was made for the last 7 days
Last 7 days support levels:
Support: 0.40 USDT on 18-12-2024
Support: 0.35 USDT on 19-12-2024
Support: 0.32 USDT on 20-12-2024
Support: 0.34 USDT on 22-12-2024
Last 7 days resistance levels:
Resistance: 0.41 USDT on 21-12-2024
Resistance: 0.37 USDT on 23-12-2024
The lowest support level is 0.32 USDT on 20-12-2024, and the highest resistance level is 0.41 USDT on 21-12-2024. The percentage difference between these levels is approximately 26.7%.
Volume
Fetched 286 data points, less than 500 days of data. Adjusting limit.
The previous trading day’s volume (22-12-2024) 22,133,809.43 USDT. Highest volume in the last 210 days is 140,705,220.34 USDT on 05-08-2024. Lowest volume in the last 210 days is 8,501,198.32 USDT on 23-12-2024. Difference between highest and lowest volume is 1555.12%.
Volume Moving Averages
( Excluding Today)
5-day Moving Average Volume: 38,995,929.78 USDT
22-day Moving Average Volume: 46,302,289.86 USDT
50-day Moving Average Volume: 45,360,415.60 USDT
100-day Moving Average Volume: 32,502,196.46 USDT
250-day Moving Average Volume: 29,671,618.37 USDT
Volume Moving Averages Comparison
Volume of the previous trading day: 22,133,809.43 USDT
Previous day’s volume is 43.24% lower than the 5-day moving average.
Previous day’s volume is 52.20% lower than the 22-day moving average.
Previous day’s volume is 51.20% lower than the 50-day moving average.
Previous day’s volume is 31.90% lower than the 100-day moving average.
Previous day’s volume is 25.40% lower than the 250-day moving average.
Percentage Differences Between Moving Averages:
5-day moving average is -15.78% lower than the 22-day moving average.
22-day moving average is 2.08% higher than the 50-day moving average.
50-day moving average is 39.56% higher than the 100-day moving average.
100-day moving average is 9.54% higher than the 250-day moving average.
Volume Trend
The longest consecutive volume increase started on 01-07-2024 with a volume of 14,267,927.93 USDT and ended on 05-07-2024 with a volume of 110,656,828.06 USDT, lasting for 4 days and representing a 675.56% increase.
The longest consecutive volume decrease started on 01-10-2024 with a volume of 39,295,710.62 USDT and ended on 06-10-2024 with a volume of 10,002,577.74 USDT, lasting for 5 days and representing a 74.55% decrease.
Price Volume Coorelation
During the longest volume increasing period price increased from 0.51 USDT to 0.35 USDT, which represents a -31.10% increase.
During the longest volume decreasing period price decreased from 0.34 USDT to 0.35 USDT, which represents a 2.49% decrease.
Strategy
The price is up today but below the 100-day moving average and 68% above the lowest level.
In the short term, if it closes with an increase for two consecutive days, the previous day’s close can be set as a stop loss and a “long” position can be opened.
In the medium term, those who want to open a “long” position from a safer place should wait for the price to close with an increase for 2 days above the 100-day moving average
AEVO
Legal Disclaimer: This Chart and The Accompanying Analyses Are Not Investment Advice.


