March 27, 2025 AEVO Daily Analysis AEVO Daily Analysis
AEVO Daily Analysis
Outlook
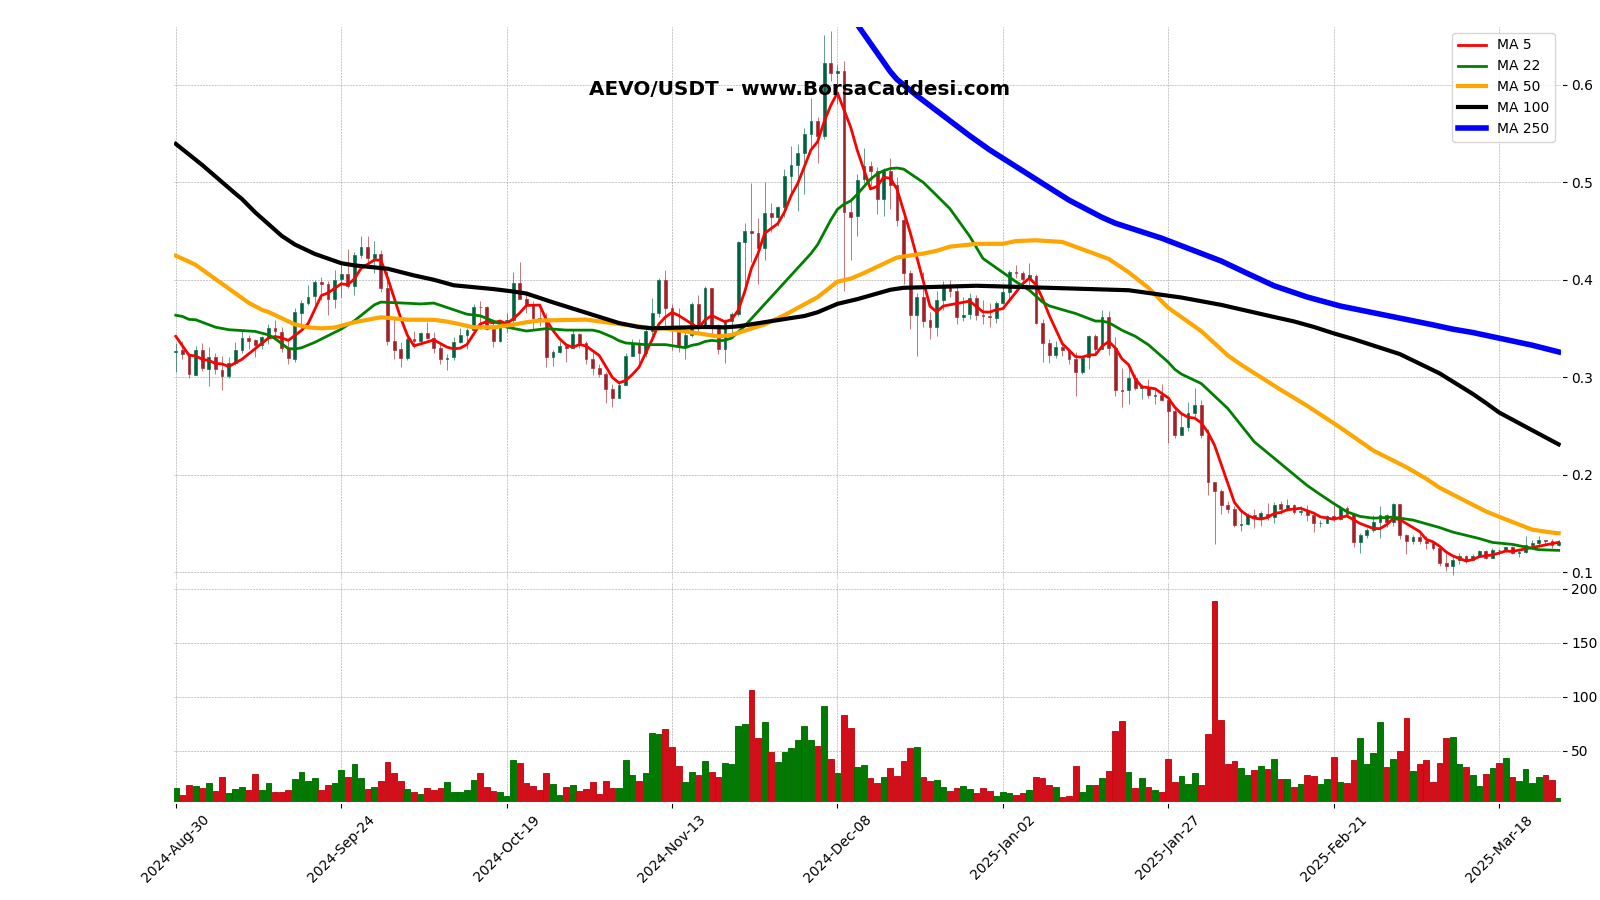
AEVO current price is 0.1314 USDT and the current market cap is 2.869.410 USDT. This chart period started 210 days ago (30 August 2024) with a total of 101 days closing above the opening price and 109 days closing below the opening price. The lowest price was 0.097 USDT on 11 March 2025, and the highest price was 0.6549 USDT on 07 December 2024. The current price is 35.46% above the lowest price and 79.94% below the highest price.
Moving Average
Moving Averages (Closing Prices):5-Day Moving Average: 0.1309222-Day Moving Average: 0.122668181850-Day Moving Average: 0.14023100-Day Moving Average: 0.231374250-Day Moving Average: 0.3261768
Moving Average Analysis
The current price is %0.37 higher than the 5-Day moving average and has been above it for 1 days.The current price is %7.12 higher than the 22-Day moving average and has been above it for 6 days.The current price is %6.30 lower than the 50-Day moving average and has been below it for 25 days.The current price is %43.21 lower than the 100-Day moving average and has been below it for 54 days.The current price is %59.72 lower than the 250-Day moving average and has been below it for 68 days.
Trends
The longest uptrend in the 210 day period is 6 days. It started at 0.4648 USDT on 28 November 2024 and ended by increasing by 21.06% to 0.5627 USDT on 04 December 2024.The longest downtrend is 6 days. It started at 0.3444 USDT on 29 October 2024 and ended by decreasing -18.96% to 0.2791 USDT on 04 November 2024.
Support & Resistance
This review was made for the last 7 daysLast 7 days support levels: Support: 0.1252 USDT on 26-03-2025Last 7 days resistance levels: Resistance: 0.1372 USDT on 22-03-2025 Resistance: 0.1371 USDT on 24-03-2025 Resistance: 0.1341 USDT on 26-03-2025The lowest support level is 0.1252 USDT on 26-03-2025, and the highest resistance level is 0.1372 USDT on 22-03-2025. The percentage difference between these levels is approximately 9.6%.
Volume
Fetched 380 data points, less than 500 days of data. Adjusting limit.The previous trading day’s volume (26-03-2025) 22,811,474.02 USDT. Highest volume in the last 210 days is 188,521,539.23 USDT on 03-02-2025. Lowest volume in the last 210 days is 6,243,932.58 USDT on 27-03-2025. Difference between highest and lowest volume is 2919.28%.
Volume Moving Averages
( Excluding Today)
5-day Moving Average Volume: 25,934,086.91 USDT22-day Moving Average Volume: 33,437,374.42 USDT50-day Moving Average Volume: 35,153,685.11 USDT100-day Moving Average Volume: 31,743,265.12 USDT250-day Moving Average Volume: 30,343,853.92 USDT
Volume Moving Averages Comparison
Volume of the previous trading day: 22,811,474.02 USDT
Previous day’s volume is 12.04% lower than the 5-day moving average.Previous day’s volume is 31.78% lower than the 22-day moving average.Previous day’s volume is 35.11% lower than the 50-day moving average.Previous day’s volume is 28.14% lower than the 100-day moving average.Previous day’s volume is 24.82% lower than the 250-day moving average.
Percentage Differences Between Moving Averages:
5-day moving average is -22.44% lower than the 22-day moving average.22-day moving average is -4.88% lower than the 50-day moving average.50-day moving average is 10.74% higher than the 100-day moving average.100-day moving average is 4.61% higher than the 250-day moving average.
Volume Trend
The longest consecutive volume increase started on 14-09-2024 with a volume of 11,815,500.43 USDT and ended on 18-09-2024 with a volume of 30,611,156.25 USDT, lasting for 4 days and representing a 159.08% increase.The longest consecutive volume decrease started on 01-10-2024 with a volume of 39,295,710.62 USDT and ended on 06-10-2024 with a volume of 10,002,577.74 USDT, lasting for 5 days and representing a 74.55% decrease.
Price Volume Coorelation
During the longest volume increasing period price increase from 0.348 USDT to 0.376 USDT, which represents a 8.05% change.During the longest volume decreasing period price increase from 0.337 USDT to 0.3454 USDT, which represents a 2.49% change.
Strategy
It has closed with a decline for the last two days. However, if the uptrend continues tomorrow, the previous day’s open can be the stop-loss, and a ‘long’ position can be taken.
Legal Disclaimer: This Chart and The Accompanying Analyses Are Not Investment Advice.


