December 23, 2024 ADA – Cardano Daily Chart Analysis
Outlook
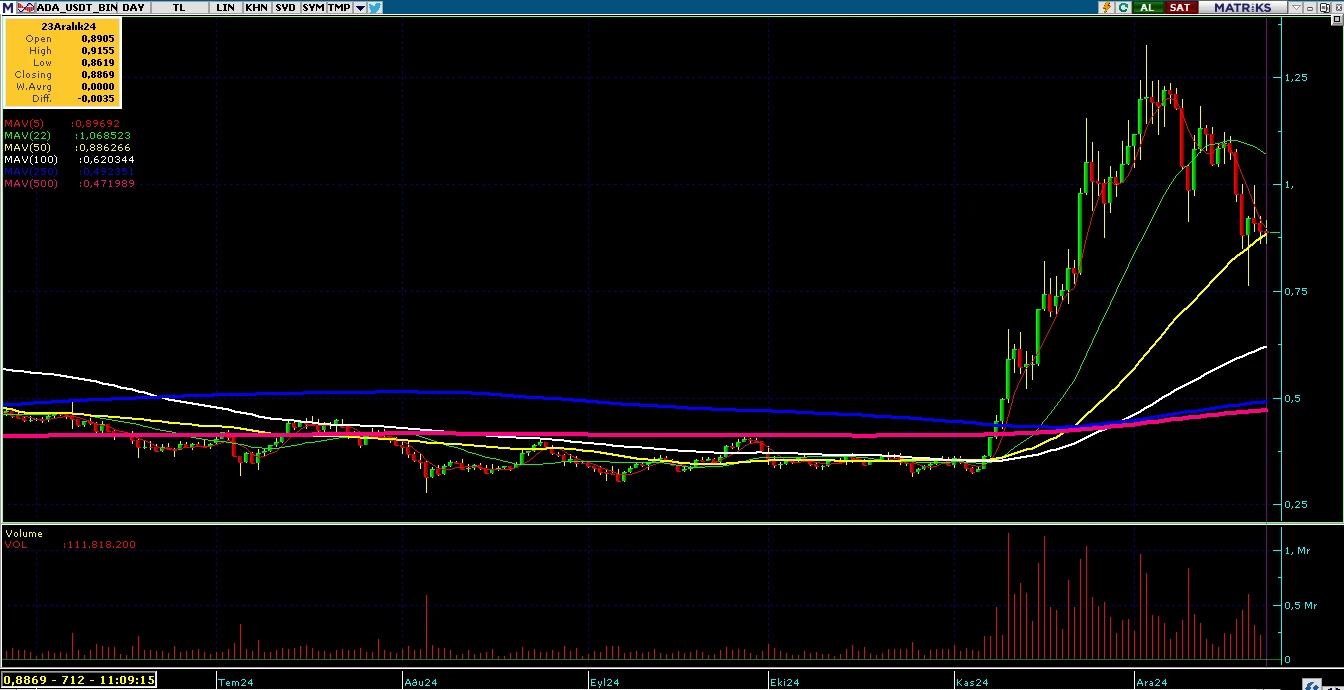
ADA current price is 0.895 USDT and the current market cap is 215.431.367 USDT. This chart period started 210 days ago (28 May 2024) with a total of 107 days closing above the opening price and 103 days closing below the opening price. The lowest price was 0.2756 USDT on 05 August 2024, and the highest price was 1.33 USDT on 03 December 2024. The current price is 224.75% above the lowest price and 32.52% below the highest price.
Moving Average
Moving Averages (Closing Prices):
5-Day Moving Average: 0.90
22-Day Moving Average: 1.07
50-Day Moving Average: 0.89
100-Day Moving Average: 0.62
250-Day Moving Average: 0.49
500-Day Moving Average: 0.47
Moving Average Analysis
The current price is %0.87 lower than the 5-Day moving average and has been below it for 0 days.
The current price is %16.22 lower than the 22-Day moving average and has been below it for 0 days.
The current price is %0.78 higher than the 50-Day moving average and has been above it for 1 days.
The current price is %44.02 higher than the 100-Day moving average and has been above it for 39 days.
The current price is %81.62 higher than the 250-Day moving average and has been above it for 45 days.
The current price is %89.54 higher than the 500-Day moving average and has been above it for 45 days.
Trends
The longest uptrend in the 210 day period is 7 days. It started at 0.33 USDT on 04 November 2024 and ended by increasing by 87.93% to 0.61 USDT on 11 November 2024.
The longest downtrend is 5 days. It started at 0.40 USDT on 27 September 2024 and ended by decreasing -14.56% to 0.34 USDT on 02 October 2024.
Support & Resistance
This review was made for the last 7 days
Last 7 days support levels:
Support: 0.96 USDT on 18-12-2024
Support: 0.85 USDT on 19-12-2024
Support: 0.76 USDT on 20-12-2024
Support: 0.86 USDT on 22-12-2024
Last 7 days resistance levels:
Resistance: 1.00 USDT on 21-12-2024
The lowest support level is 0.76 USDT on 20-12-2024, and the highest resistance level is 1.00 USDT on 21-12-2024. The percentage difference between these levels is approximately 31.0%.
Volume
The previous trading day’s volume (22-12-2024) 234,703,947.60 USDT. Highest volume in the last 210 days is 1,158,588,378.10 USDT on 10-11-2024. Lowest volume in the last 210 days is 27,057,484.00 USDT on 31-08-2024. Difference between highest and lowest volume is 4181.95%.
Volume Moving Averages
( Excluding Today)
5-day Moving Average Volume: 388,550,878.44 USDT
22-day Moving Average Volume: 381,527,173.18 USDT
50-day Moving Average Volume: 450,394,494.14 USDT
100-day Moving Average Volume: 263,584,232.47 USDT
250-day Moving Average Volume: 162,722,990.90 USDT
Volume Moving Averages Comparison
Volume of the previous trading day: 234,703,947.60 USDT
Previous day’s volume is 39.60% lower than the 5-day moving average.
Previous day’s volume is 38.48% lower than the 22-day moving average.
Previous day’s volume is 47.89% lower than the 50-day moving average.
Previous day’s volume is 10.96% lower than the 100-day moving average.
Previous day’s volume is 44.24% higher than the 250-day moving average.
Percentage Differences Between Moving Averages:
5-day moving average is 1.84% higher than the 22-day moving average.
22-day moving average is -15.29% lower than the 50-day moving average.
50-day moving average is 70.87% higher than the 100-day moving average.
100-day moving average is 61.98% higher than the 250-day moving average.
Volume Trend
The longest consecutive volume increase started on 14-12-2024 with a volume of 138,860,581.30 USDT and ended on 20-12-2024 with a volume of 594,787,205.10 USDT, lasting for 6 days and representing a 328.33% increase.
The longest consecutive volume decrease started on 22-11-2024 with a volume of 1,031,366,149.70 USDT and ended on 28-11-2024 with a volume of 254,849,669.50 USDT, lasting for 6 days and representing a 75.29% decrease.
Price Volume Coorelation
During the longest volume increasing period price increased from 1.06 USDT to 0.95 USDT, which represents a -10.45% increase.
During the longest volume decreasing period price decreased from 1.02 USDT to 1.03 USDT, which represents a 1.43% decrease.
Strategy
The 50-day moving average stands as a strong resistance. If an upward close occurs, the 50-day moving average can be determined as a support level in the short term and a “long” position can be opened.
ADA – Cardano
Legal Disclaimer: This Chart and The Accompanying Analyses Are Not Investment Advice.


