March 7, 2025 ADA – Cardano Daily Analysis ADA – Cardano Daily Analysis
ADA – Cardano Daily Analysis
Outlook
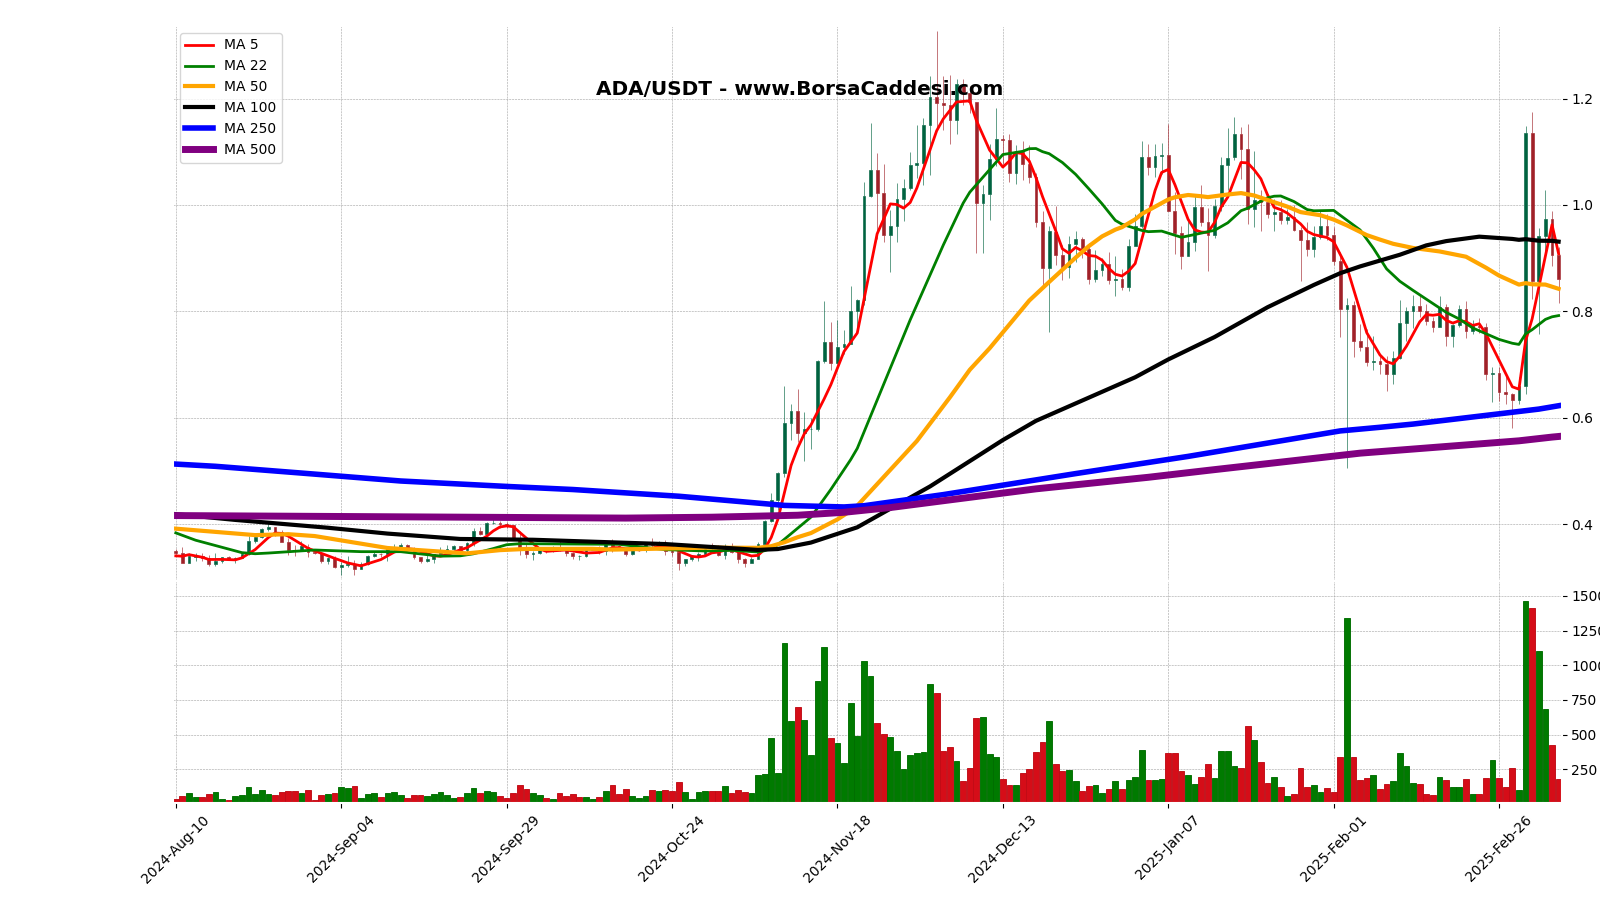
ADA current price is 0.8613 USDT and the current market cap is 517.527.635 USDT. This chart period started 210 days ago (10 August 2024) with a total of 111 days closing above the opening price and 99 days closing below the opening price. The lowest price was 0.3034 USDT on 06 September 2024, and the highest price was 1.33 USDT on 03 December 2024. The current price is 183.88% above the lowest price and 35.06% below the highest price.
Moving Average
Moving Averages (Closing Prices):5-Day Moving Average: 0.9081222-Day Moving Average: 0.7919550-Day Moving Average: 0.842316100-Day Moving Average: 0.930993250-Day Moving Average: 0.6224104500-Day Moving Average: 0.5646382
Moving Average Analysis
The current price is %5.16 lower than the 5-Day moving average and has been below it for 2 days.The current price is %8.76 higher than the 22-Day moving average and has been above it for 6 days.The current price is %2.25 higher than the 50-Day moving average and has been above it for 6 days.The current price is %7.49 lower than the 100-Day moving average and has been below it for 2 days.The current price is %38.38 higher than the 250-Day moving average and has been above it for 113 days.The current price is %52.54 higher than the 500-Day moving average and has been above it for 118 days.
Trends
The longest uptrend in the 210 day period is 7 days. It started at 0.3263 USDT on 04 November 2024 and ended by increasing by 87.93% to 0.6132 USDT on 11 November 2024.The longest downtrend is 5 days. It started at 0.4017 USDT on 27 September 2024 and ended by decreasing -14.56% to 0.3432 USDT on 02 October 2024.
Support & Resistance
This review was made for the last 7 daysLast 7 days support levels: Support: 0.7576 USDT on 04-03-2025 Support: 0.8854 USDT on 06-03-2025 Support: 0.8165 USDT on 07-03-2025Last 7 days resistance levels: Resistance: 1.15 USDT on 02-03-2025 Resistance: 1.17 USDT on 03-03-2025 Resistance: 1.03 USDT on 05-03-2025The lowest support level is 0.7576 USDT on 04-03-2025, and the highest resistance level is 1.17 USDT on 03-03-2025. The percentage difference between these levels is approximately 55.1%.
Volume
The previous trading day’s volume (06-03-2025) 426,709,138.10 USDT. Highest volume in the last 210 days is 1,462,027,409.90 USDT on 02-03-2025. Lowest volume in the last 210 days is 27,057,484.00 USDT on 31-08-2024. Difference between highest and lowest volume is 5303.41%.
Volume Moving Averages
( Excluding Today)
5-day Moving Average Volume: 1,017,331,937.88 USDT22-day Moving Average Volume: 345,830,346.28 USDT50-day Moving Average Volume: 297,870,736.97 USDT100-day Moving Average Volume: 295,422,767.25 USDT250-day Moving Average Volume: 213,277,505.25 USDT
Volume Moving Averages Comparison
Volume of the previous trading day: 426,709,138.10 USDT
Previous day’s volume is 58.06% lower than the 5-day moving average.Previous day’s volume is 23.39% higher than the 22-day moving average.Previous day’s volume is 43.25% higher than the 50-day moving average.Previous day’s volume is 44.44% higher than the 100-day moving average.Previous day’s volume is 100.07% higher than the 250-day moving average.
Percentage Differences Between Moving Averages:
5-day moving average is 194.17% higher than the 22-day moving average.22-day moving average is 16.10% higher than the 50-day moving average.50-day moving average is 0.83% higher than the 100-day moving average.100-day moving average is 38.52% higher than the 250-day moving average.
Volume Trend
The longest consecutive volume increase started on 14-12-2024 with a volume of 138,860,581.30 USDT and ended on 20-12-2024 with a volume of 594,787,205.10 USDT, lasting for 6 days and representing a 328.33% increase.The longest consecutive volume decrease started on 22-11-2024 with a volume of 1,031,366,149.70 USDT and ended on 28-11-2024 with a volume of 254,849,669.50 USDT, lasting for 6 days and representing a 75.29% decrease.
Price Volume Coorelation
During the longest volume increasing period price decrease from 1.06 USDT to 0.9501 USDT, which represents a -10.45% change.During the longest volume decreasing period price increase from 1.02 USDT to 1.03 USDT, which represents a 1.43% change.
Strategy
There is no trend formation at the moment. We should wait until a trend forms.
Legal Disclaimer: This Chart and The Accompanying Analyses Are Not Investment Advice.


