December 23, 2024 AAVE Daily Chart Analysis
Outlook
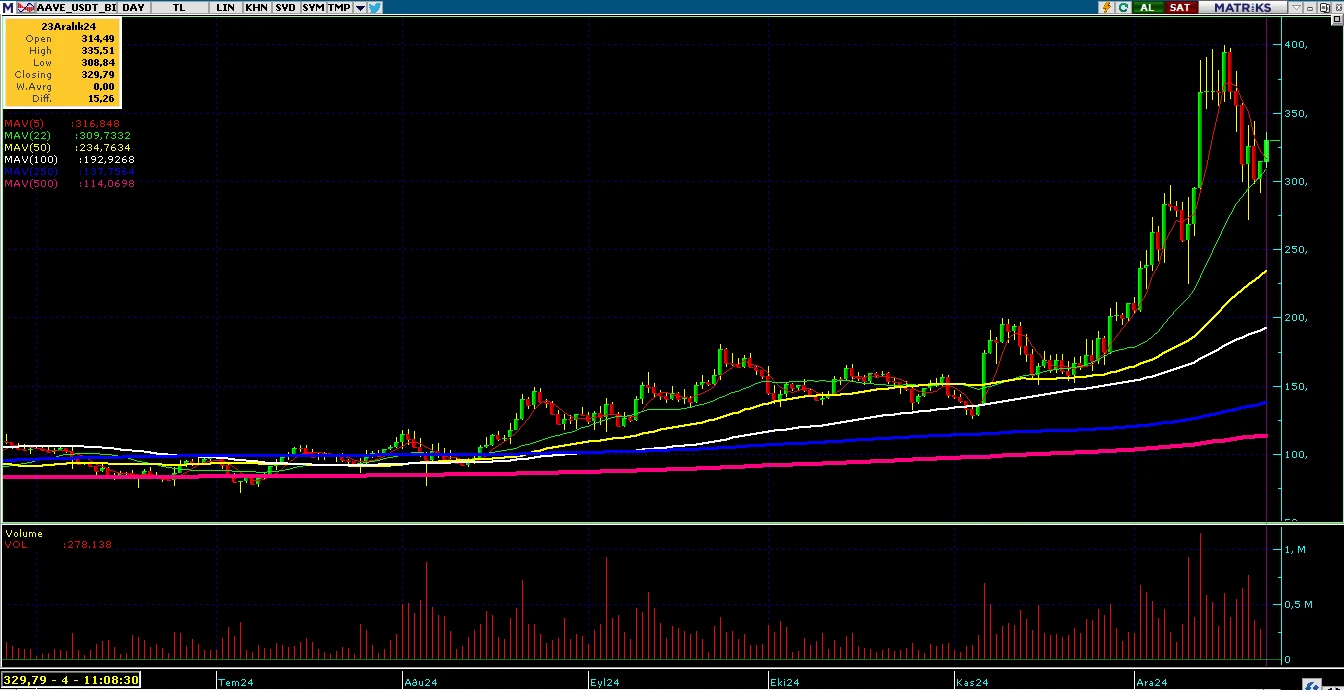
AAVE current price is 333.48 USDT and the current market cap is 141.660.486 USDT. This chart period started 210 days ago (28 May 2024) with a total of 106 days closing above the opening price and 104 days closing below the opening price. The lowest price was 71.06 USDT on 05 July 2024, and the highest price was 399.85 USDT on 16 December 2024. The current price is 369.29% above the lowest price and 16.60% below the highest price.
Moving Average
Moving Averages (Closing Prices):
5-Day Moving Average: 319.19
22-Day Moving Average: 310.06
50-Day Moving Average: 235.62
100-Day Moving Average: 193.41
250-Day Moving Average: 137.96
500-Day Moving Average: 114.17
Moving Average Analysis
The current price is %4.48 higher than the 5-Day moving average and has been above it for 1 days.
The current price is %7.55 higher than the 22-Day moving average and has been above it for 2 days.
The current price is %41.54 higher than the 50-Day moving average and has been above it for 21 days.
The current price is %72.42 higher than the 100-Day moving average and has been above it for 27 days.
The current price is %141.72 higher than the 250-Day moving average and has been above it for 48 days.
The current price is %192.09 higher than the 500-Day moving average and has been above it for 127 days.
Trends
The longest uptrend in the 210 day period is 7 days. It started at 78.20 USDT on 07 July 2024 and ended by increasing by 33.50% to 104.40 USDT on 14 July 2024.
The longest downtrend is 5 days. It started at 170.39 USDT on 27 September 2024 and ended by decreasing -18.34% to 139.14 USDT on 02 October 2024.
Support & Resistance
This review was made for the last 7 days
Last 7 days support levels:
Support: 336.00 USDT on 18-12-2024
Support: 298.96 USDT on 19-12-2024
Support: 271.50 USDT on 20-12-2024
Support: 291.02 USDT on 22-12-2024
Last 7 days resistance levels:
Resistance: 344.10 USDT on 21-12-2024
Resistance: 335.51 USDT on 23-12-2024
The lowest support level is 271.50 USDT on 20-12-2024, and the highest resistance level is 344.10 USDT on 21-12-2024. The percentage difference between these levels is approximately 26.7%.
Volume
The previous trading day’s volume (22-12-2024) 307,067.67 USDT. Highest volume in the last 210 days is 1,140,491.48 USDT on 12-12-2024. Lowest volume in the last 210 days is 32,836.56 USDT on 01-06-2024. Difference between highest and lowest volume is 3373.24%.
Volume Moving Averages
( Excluding Today)
5-day Moving Average Volume: 517,640.72 USDT
22-day Moving Average Volume: 502,889.88 USDT
50-day Moving Average Volume: 398,215.08 USDT
100-day Moving Average Volume: 283,726.27 USDT
250-day Moving Average Volume: 227,856.50 USDT
Volume Moving Averages Comparison
Volume of the previous trading day: 307,067.67 USDT
Previous day’s volume is 40.68% lower than the 5-day moving average.
Previous day’s volume is 38.94% lower than the 22-day moving average.
Previous day’s volume is 22.89% lower than the 50-day moving average.
Previous day’s volume is 8.23% higher than the 100-day moving average.
Previous day’s volume is 34.76% higher than the 250-day moving average.
Percentage Differences Between Moving Averages:
5-day moving average is 2.93% higher than the 22-day moving average.
22-day moving average is 26.29% higher than the 50-day moving average.
50-day moving average is 40.35% higher than the 100-day moving average.
100-day moving average is 24.52% higher than the 250-day moving average.
Volume Trend
The longest consecutive volume increase started on 10-08-2024 with a volume of 90,999.42 USDT and ended on 15-08-2024 with a volume of 429,368.29 USDT, lasting for 5 days and representing a 371.84% increase.
The longest consecutive volume decrease started on 16-07-2024 with a volume of 196,597.23 USDT and ended on 20-07-2024 with a volume of 47,338.82 USDT, lasting for 4 days and representing a 75.92% decrease.
Price Volume Coorelation
During the longest volume increasing period price increased from 93.31 USDT to 107.80 USDT, which represents a 15.53% increase.
During the longest volume decreasing period price decreased from 100.62 USDT to 99.00 USDT, which represents a -1.61% decrease.
Strategy
Yesterday, it closed with an increase by getting support from the 22-day moving average. Today, it is trading above the 5-day moving average, and a “long” position can be opened by determining the 5-day moving average as the stop loss level.
AAVE
Legal Disclaimer: This Chart and The Accompanying Analyses Are Not Investment Advice.


