March 5, 2025 AAVE Daily Analysis AAVE Daily Analysis
AAVE Daily Analysis
Outlook
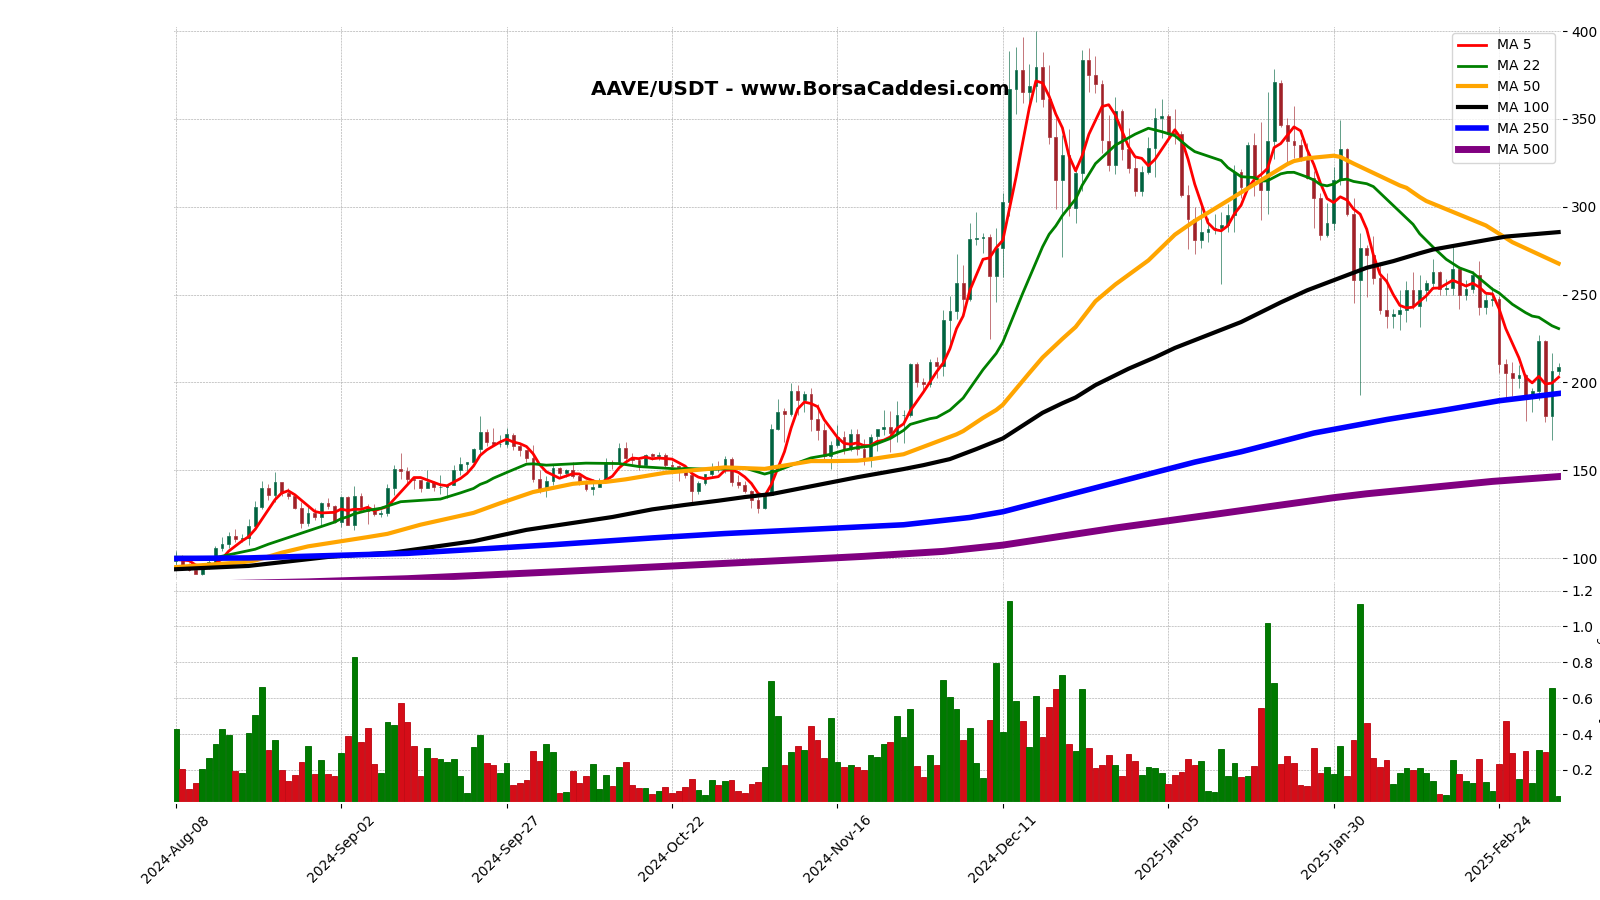
AAVE current price is 208.82 USDT and the current market cap is 124.081.044 USDT. This chart period started 210 days ago (08 August 2024) with a total of 106 days closing above the opening price and 104 days closing below the opening price. The lowest price was 90.19 USDT on 12 August 2024, and the highest price was 399.85 USDT on 16 December 2024. The current price is 131.53% above the lowest price and 47.78% below the highest price.
Moving Average
Moving Averages (Closing Prices):5-Day Moving Average: 202.9922-Day Moving Average: 230.6850-Day Moving Average: 267.68100-Day Moving Average: 285.59250-Day Moving Average: 193.71500-Day Moving Average: 146.43
Moving Average Analysis
The current price is %2.87 higher than the 5-Day moving average and has been above it for 2 days.The current price is %9.48 lower than the 22-Day moving average and has been below it for 10 days.The current price is %21.99 lower than the 50-Day moving average and has been below it for 29 days.The current price is %26.88 lower than the 100-Day moving average and has been below it for 32 days.The current price is %7.80 higher than the 250-Day moving average and has been above it for 2 days.The current price is %42.60 higher than the 500-Day moving average and has been above it for 120 days.
Trends
The longest uptrend in the 210 day period is 7 days. It started at 140.30 USDT on 16 September 2024 and ended by increasing by 22.56% to 171.95 USDT on 23 September 2024.The longest downtrend is 7 days. It started at 370.80 USDT on 21 January 2025 and ended by decreasing -23.37% to 284.16 USDT on 28 January 2025.
Support & Resistance
This review was made for the last 7 daysLast 7 days support levels: Support: 178.21 USDT on 28-02-2025 Support: 177.73 USDT on 03-03-2025 Support: 167.52 USDT on 04-03-2025Last 7 days resistance levels: Resistance: 227.00 USDT on 02-03-2025The lowest support level is 167.52 USDT on 04-03-2025, and the highest resistance level is 227.00 USDT on 02-03-2025. The percentage difference between these levels is approximately 35.5%.
Volume
The previous trading day’s volume (04-03-2025) 654,727.54 USDT. Highest volume in the last 210 days is 1,140,491.48 USDT on 12-12-2024. Lowest volume in the last 210 days is 54,040.68 USDT on 05-03-2025. Difference between highest and lowest volume is 2010.43%.
Volume Moving Averages
( Excluding Today)
5-day Moving Average Volume: 339,800.71 USDT22-day Moving Average Volume: 221,380.63 USDT50-day Moving Average Volume: 272,892.73 USDT100-day Moving Average Volume: 318,902.01 USDT250-day Moving Average Volume: 270,361.06 USDT
Volume Moving Averages Comparison
Volume of the previous trading day: 654,727.54 USDT
Previous day’s volume is 92.68% higher than the 5-day moving average.Previous day’s volume is 195.75% higher than the 22-day moving average.Previous day’s volume is 139.92% higher than the 50-day moving average.Previous day’s volume is 105.31% higher than the 100-day moving average.Previous day’s volume is 142.17% higher than the 250-day moving average.
Percentage Differences Between Moving Averages:
5-day moving average is 53.49% higher than the 22-day moving average.22-day moving average is -18.88% lower than the 50-day moving average.50-day moving average is -14.43% lower than the 100-day moving average.100-day moving average is 17.95% higher than the 250-day moving average.
Volume Trend
The longest consecutive volume increase started on 10-08-2024 with a volume of 90,999.42 USDT and ended on 15-08-2024 with a volume of 429,368.29 USDT, lasting for 5 days and representing a 371.84% increase.The longest consecutive volume decrease started on 15-10-2024 with a volume of 242,676.99 USDT and ended on 19-10-2024 with a volume of 65,337.17 USDT, lasting for 4 days and representing a 73.08% decrease.
Price Volume Coorelation
During the longest volume increasing period price increase from 93.31 USDT to 107.80 USDT, which represents a 15.53% change.During the longest volume decreasing period price increase from 156.79 USDT to 158.15 USDT, which represents a 0.87% change.
Strategy
There is no trend formation at the moment. We should wait until a trend forms.
Legal Disclaimer: This Chart and The Accompanying Analyses Are Not Investment Advice.


